Analysis and data visualisation
We specialise in turning complex healthcare data into actionable insights through advanced analysis and data visualisation techniques. Our interactive dashboards empower teams to make evidence-based decisions, improve outcomes, and drive real-world impact.
At Unity Insights, we turn complex healthcare data into meaningful, actionable insight. Through robust analysis and intuitive data visualisation, we help organisations understand trends, track performance, and make evidence-based decisions. Whether you need clarity across multiple data sources or engaging visuals to support strategic conversations, we create practical solutions that makes your data trusted and usable, empowering better outcomes/decisions.
Why choose Unity Insights for analysis and data visualisation?
Unity Insights brings deep experience across healthcare datasets, applied analytics, and real-world service evaluation. We combine analytical rigour with practical usability, ensuring that organisations not only receive high‑quality analysis, but can also apply it confidently in real-world settings.
We specialise in transforming complex datasets into clear, intuitive dashboards that support decision-making at every level. Our tools enable you to quickly identify trends, drill into local or population-specific insights, and tailor views to what matters most to you. Co-designed with technical and non-technical users in mind, our dashboards enable stakeholders to confidently interpret and act on data. Our solutions can incorporate automated updates, geographical breakdowns, health inequalities analysis, and tailored metrics, ensuring insights remain timely, relevant, and decision-ready.
What we offer
Unity Insights provides a range of data analysis and visualisation services:
Data analysis
- Impact analysis – We assess how interventions influence downstream outcomes such as hospital admissions, workforce capacity, service utilisation, and patient flow. Using pre- and post- intervention analysis, counterfactual modelling, and identifying drivers of change, we help organisations understand whether a programme is delivering meaningful real‑world impact.
- Inequalities analysis – Our team examines how outcomes vary across demographic, socioeconomic, or geographic groups to identify disparities and priority populations. Leveraging multi‑source datasets, we assess where interventions may be widening or reducing inequalities, and provide evidence‑based recommendations to support targeted improvement.
- Market analysis for innovation adoption – For organisations looking to launch or scale innovations, we conduct research to identify where demand is highest. This includes analysing disease burden, unmet need, service variation, and population characteristics across regions to pinpoint high‑priority regions and population segments.
- Evaluation analytics – We design and deliver analytical components of evaluations, combining quantitative evidence with qualitative insight to understand programme effectiveness, value, and implementation considerations.
Data visualisation
- Data consolidation and integration – We combine multiple data sources into a single, coherent, and navigable analysis or dashboard environment.
- Custom visualisations – From charts and graphs to inequality overlays and dynamic comparisons, we design visuals that resonate with diverse audiences and highlight the insights that matter.
- Interactive dashboards – Built in Tableau, Power BI or Excel, our dashboards include custom filters, drill‑down features, geographic mapping, inequality overlays, and tailored metric views. Automated refresh options ensure insights remain up to date.
- Exportable outputs – Visuals can be easily integrated into board papers, reports, case studies, and presentations.
Experience the power of data visualisation:
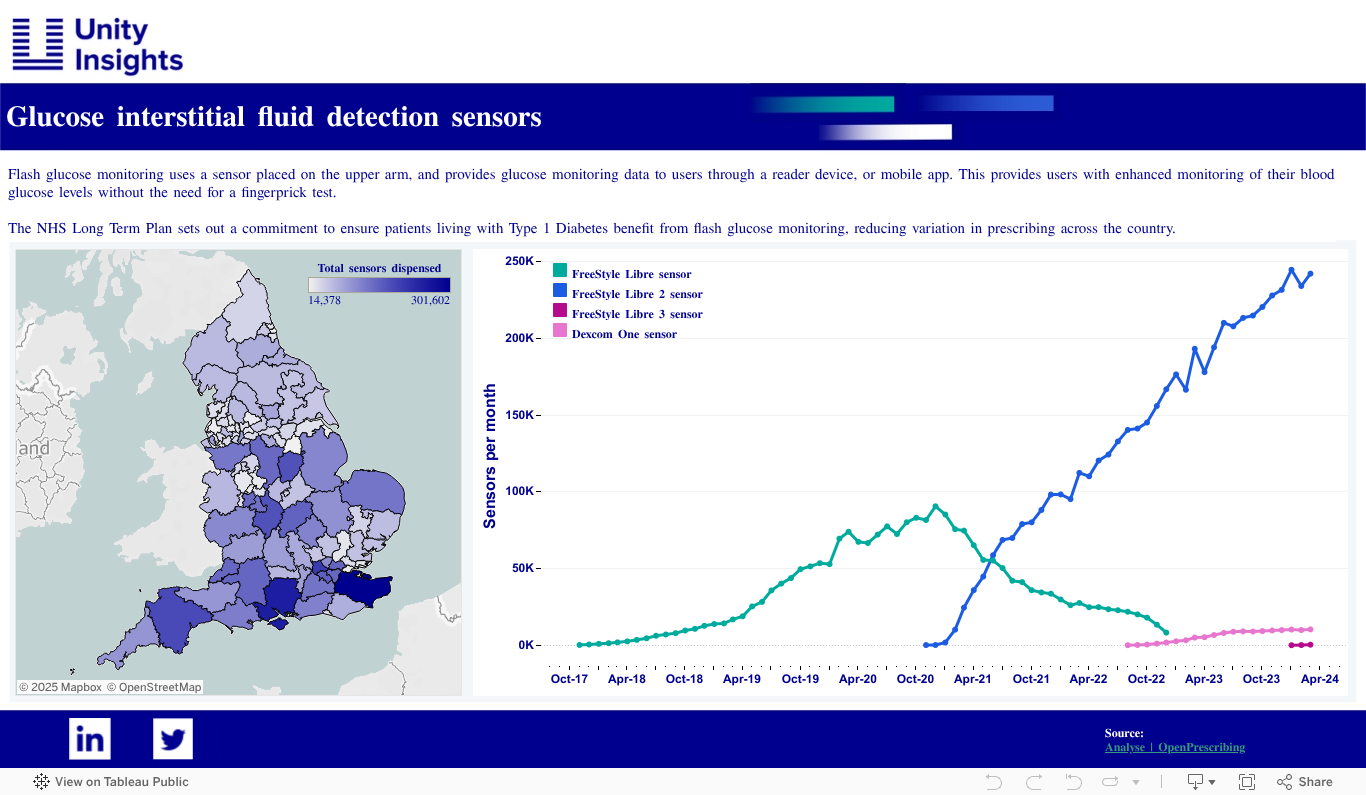
Our interactive dashboards showcase how Unity Insights transforms complex data into engaging, actionable insights. With the ability to filter, explore, and extract key trends, our dashboards demonstrates:
- Geographical visualisations: Drill down to site-specific data to understand local outcomes
- Dynamic filters: Adjust views to focus on specific metrics or population segments
- Health inequalities analysis: Overlay multiple data sources to identify disparities. Interact with the dashboard below and see how Unity Insights can bring your data to life!
Explore our interactive dashboard
.
Contact us
Get in touch


Past projects

Population health dashboard development
Read more
Learning about data analytics and impact assessment as part of Digital Fellowship programmes
Read more
Health Innovation Oxford & Thames Valley Health Inequalities dashboard suite
Read more
Impact reporting – Kent, Surrey, Sussex
Read more
Intelligent Intermittent Auscultation Dashboard
Read more
Health Education England AI Roadmap
Read more
Acute Heart Failure
Read more